Power BI Visuals Built for Research
Custom visuals with built-in statistical significance testing, designed for marketing and market research professionals who demand rigor in every report.
Features
Rigorous analysis, beautiful presentation
Chartura visuals bridge the gap between statistical accuracy and compelling data storytelling — without leaving Power BI.
Statistical Significance Testing
Built-in hypothesis testing with configurable confidence levels. Instantly surface statistically significant differences across waves, segments, and time periods.
Survey-Ready Formatting
Purpose-built for Likert scales, NPS, and brand tracking studies. Display significance letters, column groups, and row hierarchies exactly as your audience expects.
Native Power BI Integration
Drop visuals directly into your Power BI reports. Fully compatible with filters, slicers, cross-highlighting, and the Power BI formatting pane.
Enterprise Ready
Available on Microsoft Marketplace. Meets Power BI security and compliance standards — no data leaves your environment.
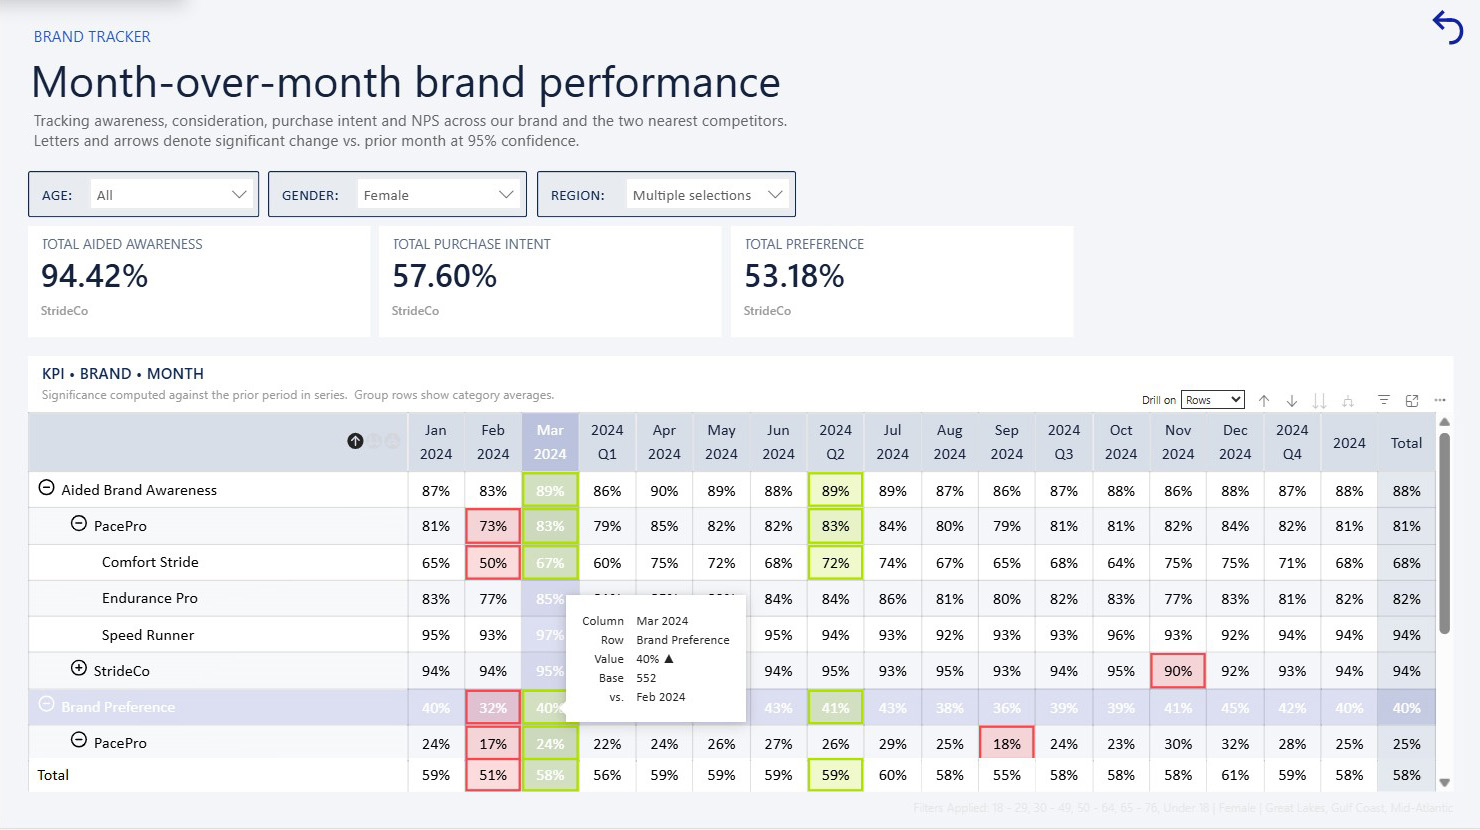
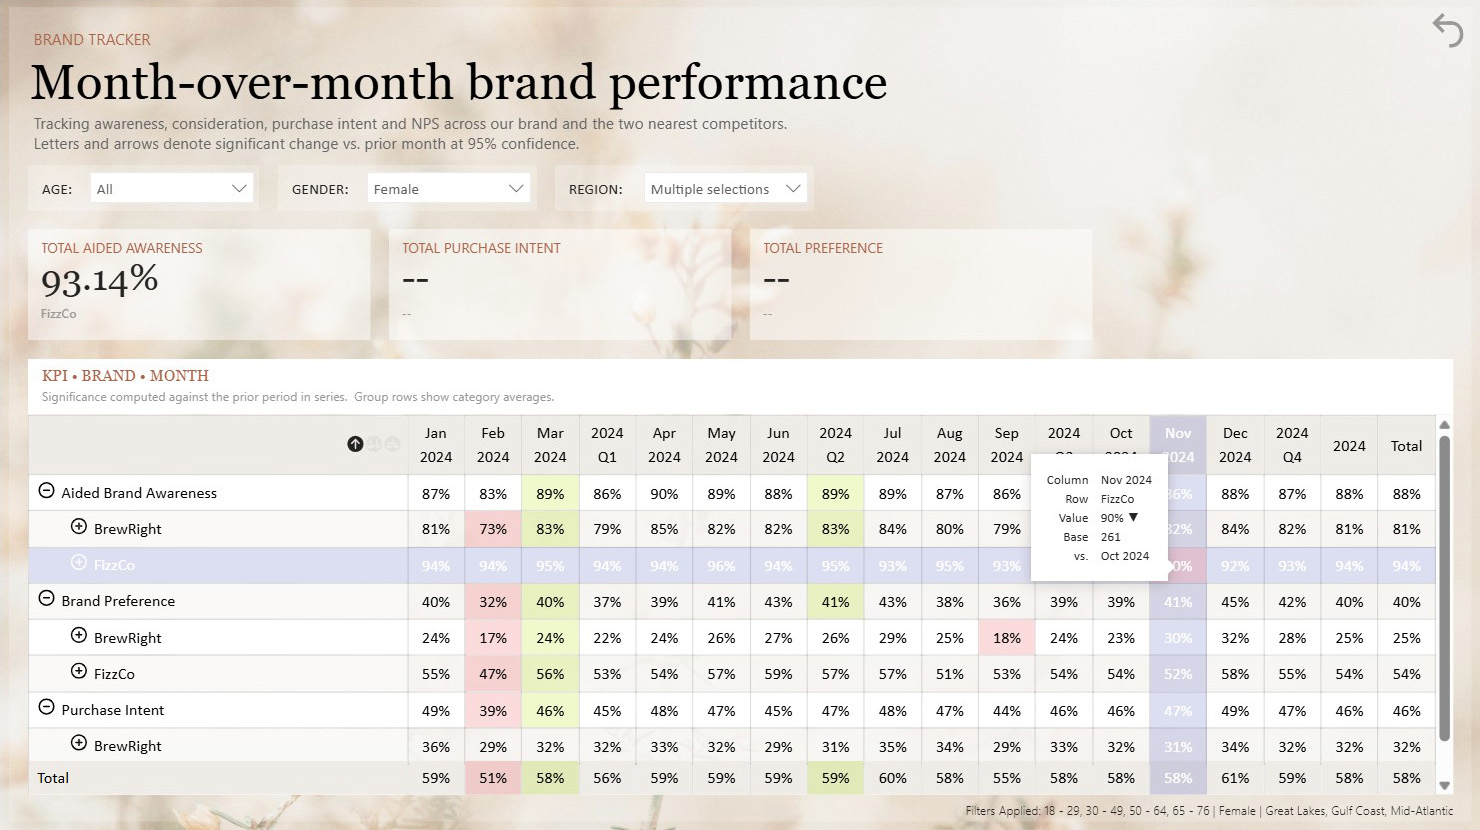
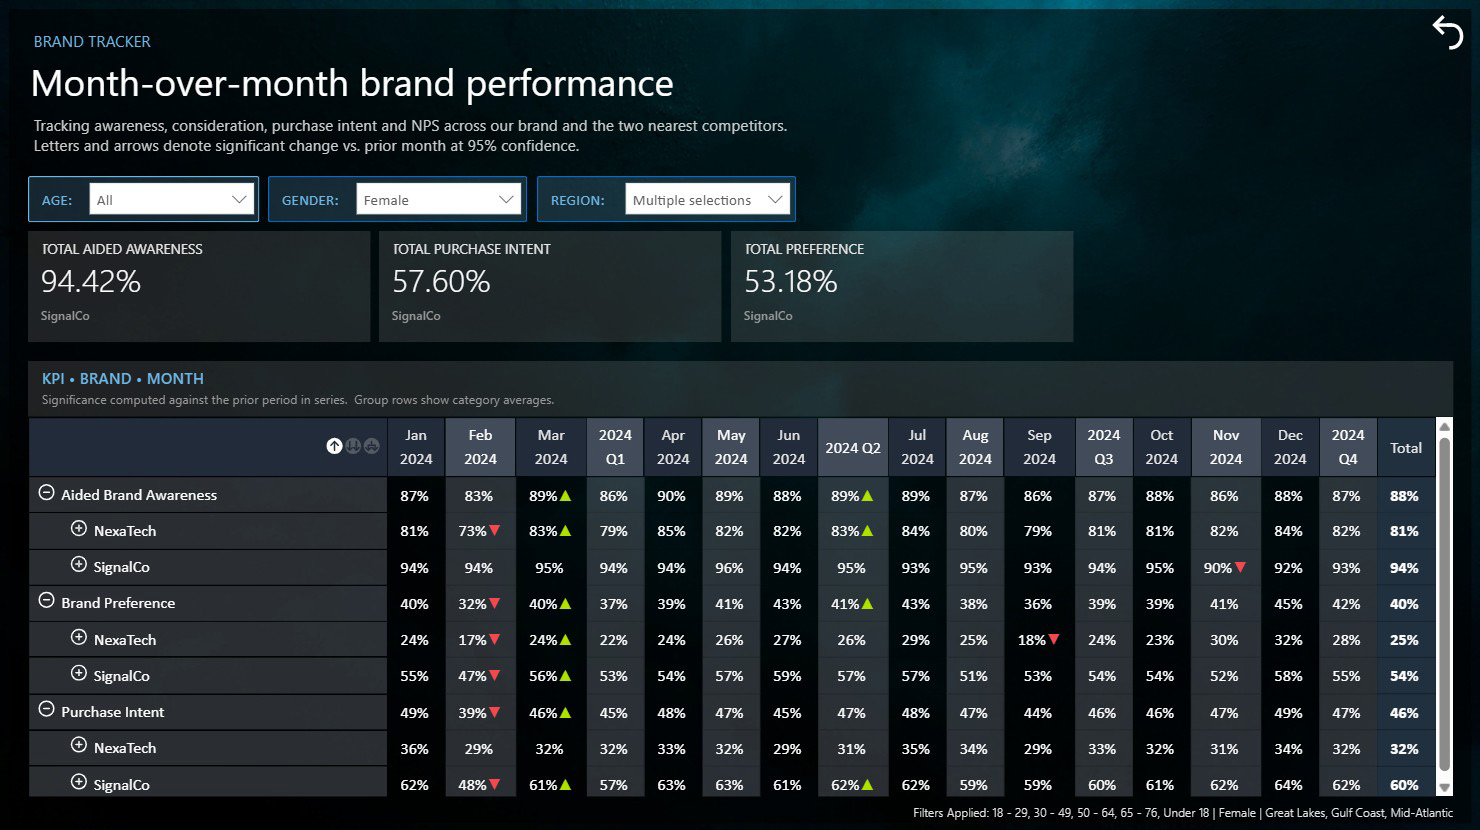
Wave Significance Table
Significance testing built into every row
Automatically flags significant changes between the current and previous wave, with configurable confidence levels and full formatting control inside the Power BI formatting pane.
Corporate
Wave Significance Table — available now on Microsoft Marketplace
Built For
Designed for professionals who value precision
Market Researchers
Run significance tests on survey data, track brand health metrics, and deliver statistically sound insights without leaving Power BI.
Marketing Analysts
Compare campaign performance across segments with confidence. Know which differences are real and which are noise.
Insights Leaders
Present findings that stakeholders trust. Statistical rigour made visually compelling — no custom scripting required.